CPU profiling in python
-
using
cProfilecli commandpython -m cProfile code.py -
using
cProfile.runmethodfrom time import sleep if __name__ == '__main__': import cProfile cProfile.run('sleep(1)', filename='result.out') -
using
pstatto see the resultpython -m pstat result.outWelcome to the profile statistics browser.
code.out% -
sort by total time
sort tottime -
top 3 position in statistic
stats 3code.out% stats 3
Wed Jul 27 08:47:41 2022 code.out15 function calls (14 primitive calls) in 1.003 seconds
Ordered by: internal time
List reduced from 12 to 3 due to restriction <3>
ncalls tottime percall cumtime percall filename:lineno(function) 5
1 1.002 1.002 1.002 1.002 {built-in method time.sleep}
1 0.000 0.000 1.003 1.003 {built-in method builtins.exec}
1 0.000 0.000 1.002 1.002:1( ) -
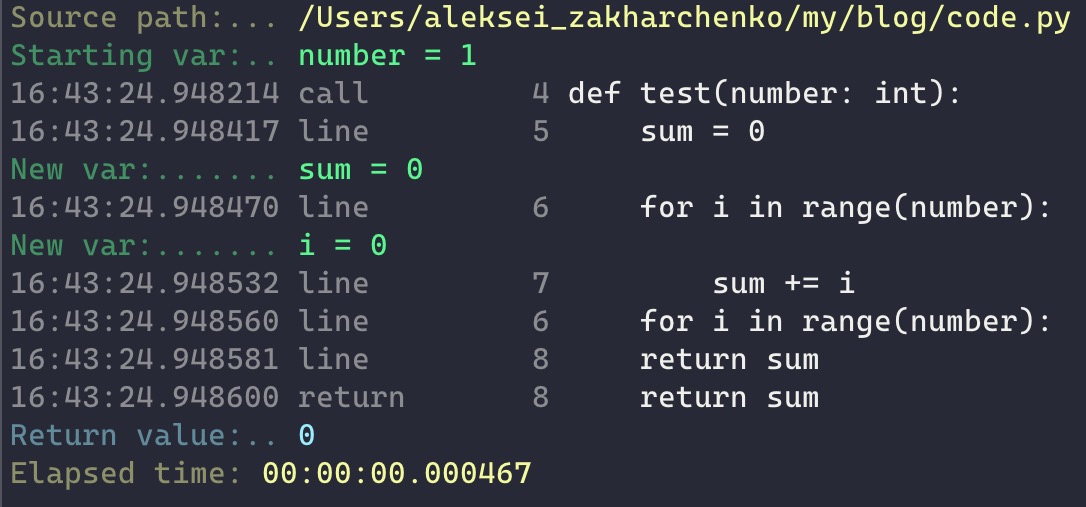
using pysnooper
installation
pip3 install pysnooperexample
 import pysnooper

 @pysnooper.snoop()
 def test(number: int):
     sum = 0
     for i in range(number):
         sum += i
     return sum

 if __name__ == '__main__':
     test(1)